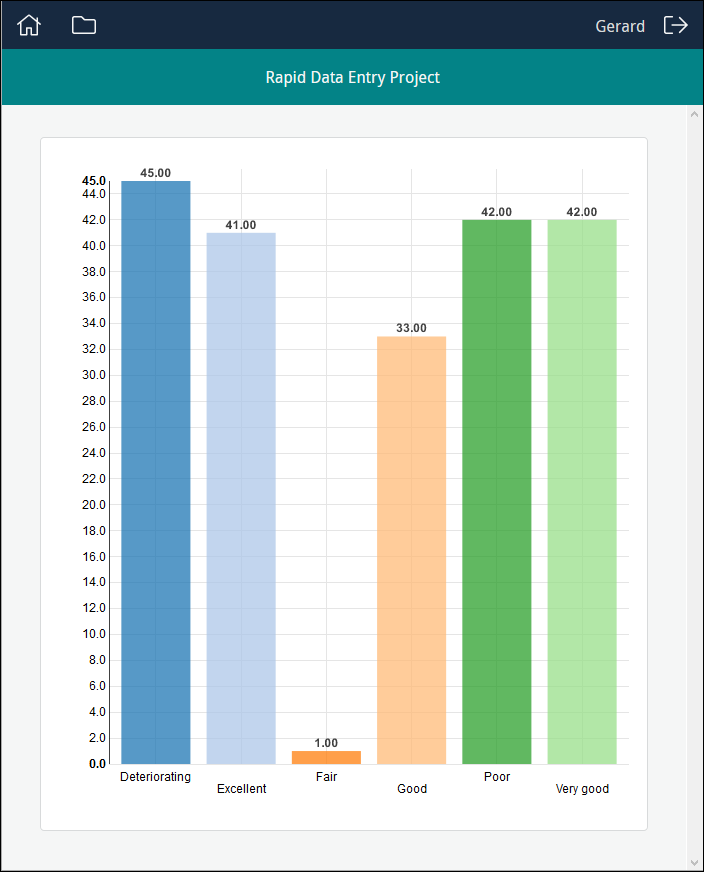
Authorized users (Managers) can be provided with graphs (bar and pie) presenting any sort of statistical data (the progress of a project, the condition of objects, etc.). A graph can be pointed at any column in any module, but some columns will be more useful to represent in a graph than others. This example graphically displays the condition of objects in the Catalogue:
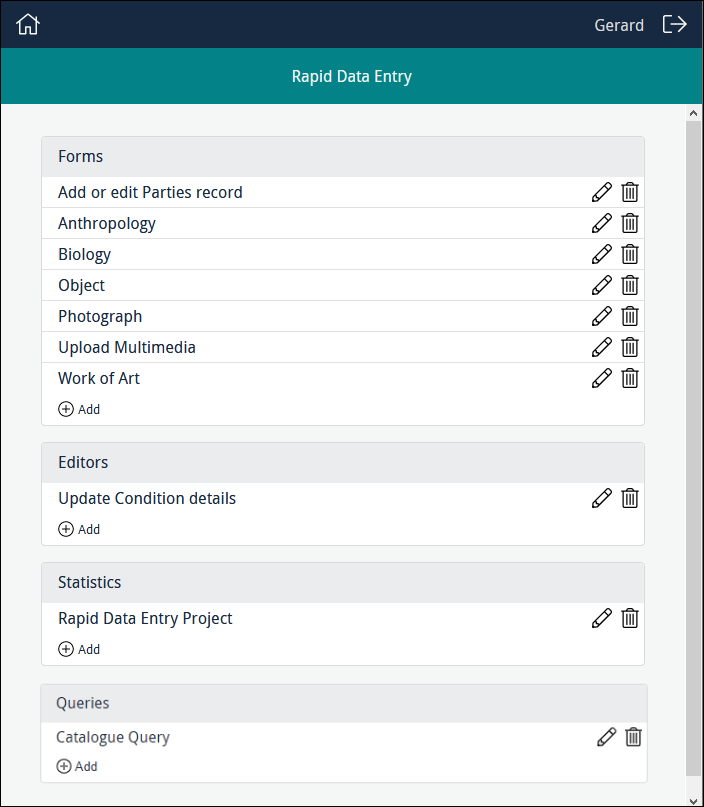
When a Programme Lead accesses a project, any Forms, Editors and Statistics tools already created will be listed, along with options to edit, delete and add new instances of them, e.g.:
To build a new Statistical graph, click  in the Statistics section. The Statistical graph creator displays. Here you configure a Statistical graph and assign permissions to users.
To edit an existing Statistical graph, click  beside a Statistical graph's title. The Statistical graph will open ready for editing.
The graph above is configured as:
|
Title |
A descriptive name for the graph, which will be listed in the Statistics section for authorized users. |
|
Description |
A description of the purpose of the graph. When users access the graph, an Information icon will display alongside the title. Clicking the icon will display a popup with details about the graph. |
|
Identifier |
A descriptive identifier for the Statistical graph (or leave blank and an alphanumeric identifier will be assigned automatically). |
|
Table |
The module that holds the data that will be graphed. |
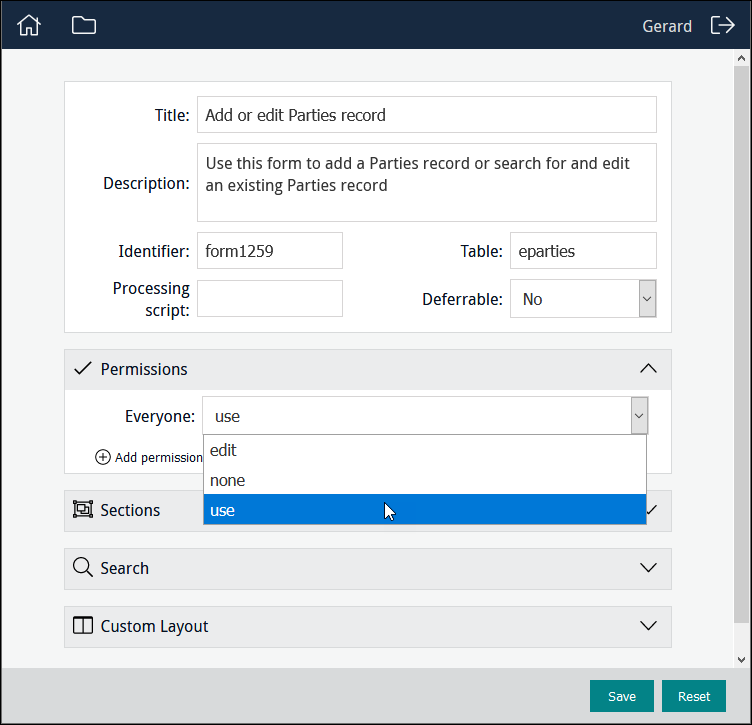
Three permissions for project elements (Forms, Editors, Statistics, Tasks, Query pages) can be assigned :
|
|
This is the default state for Everyone when a project element is created: the element is not available to users and will not be listed when they log in. |
|
|
When assigned, the project element will be listed when an authorized user logs in. The user can use the project element but not modify it. |
|
|
When assigned, the project element will be listed when an authorized user logs in. The user can use the project element, modify and delete it. When the project element is listed in the Dashboard, the edit |
To change access permissions that affect all users of a project element, select the appropriate permission from the Everyone drop list:
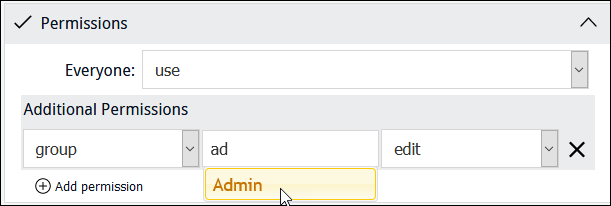
To change access permissions to a project element for a specific user or group:
- Click
 .
.Additional fields display:
- Select user or group from the first drop list.
- Begin keying a user or group name in the second field and select a name from the list of suggestions that will display:
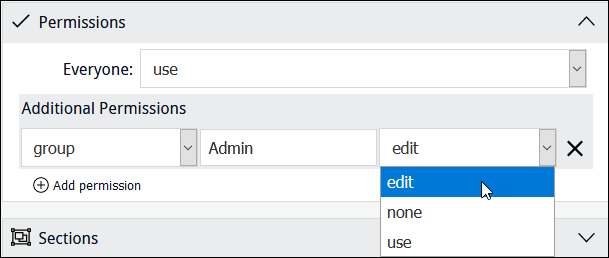
- Select a permission from the Permissions drop-list:
Note: Click  beside an assigned user or group permission to remove it.
|
Type |
The type of graph:
|
|
Sort Column |
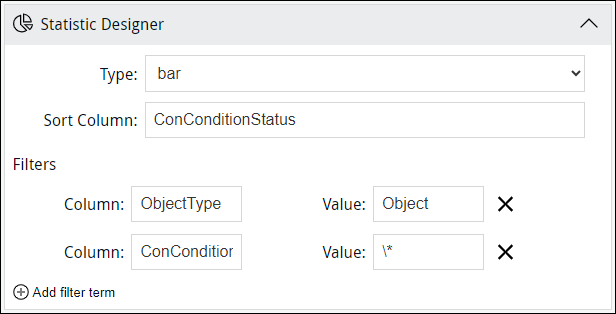
A graph can be pointed at any column in any module, and it is possible to filter the data before it is presented in a graph. In Sort Column you select the column holding the data to be graphed. It is possible to filter values returned from Sort Column:
In the example above, two filters have been specified: The first filter tells Sapphire to return records only where: ObjectType = Object The second tells Sapphire to return records only if there is a value in the ConConditionStatus field. If Column is a date field (it has a date data type), it is possible to enter a date or to select from a drop list of date values (today, this year, etc.)1: If Column is a date field, it is possible to enter a date or to select from a drop list of date values, making the filter dynamic, relative to the current date: Values are:
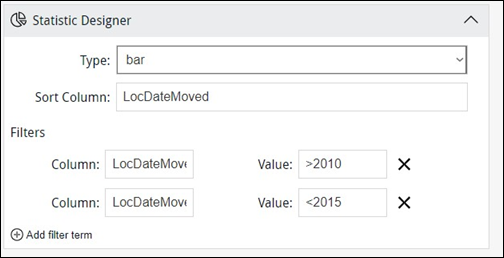
Date range queries are also possible using the following operators2: Only single dates in a value box are currently supported, e.g.:
and a value such as Valid date formats are dd/mm/yyyy, mm/yyyy and yyyy and an error message will display if non valid date values are entered (on saving the Statistics element)3. |
4. Save the graph.

 icons will display beside its name.

 .
.